Graphics created for a client
15 January 2020

We often help our clients with creating graphics for use in print, publications and PowerPoint. Here is a little insight on a project we recently completed.
Working with many pharmaceutical clients throughout the year means learning some interesting things as well as having to create visually pleasing graphics from scientific information.
We were contacted by one of our clients with a brief to create an interesting and simplified way of displaying how a particular mutation of a disease had been carried down through several generations of a family.
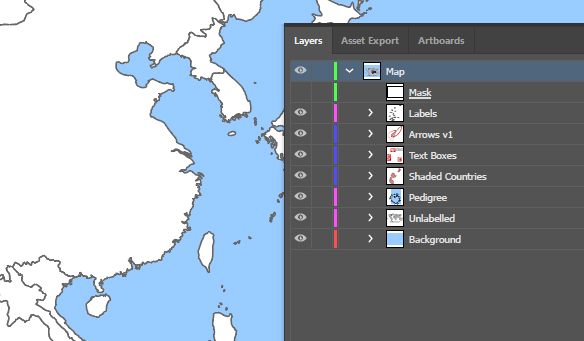
The client supplied a rough drawing of how it would need to be displayed so we translated this idea into a vector graphic using Adobe Illustrator.
Additionally, we also had to create a pedigree chart by importing CSV data into a piece of software (created in the 90s, which is always a challenge when dealing with compatability issues) to generate a scientifically accurate family tree indicating which family members had acquired this mutation. This chart was not automatically generated quite right so we had to also bring this in to Illustrator and edit it manually.
Final files were supplied in high-resolution PNG, as well as PDF and TIF files.
